An air quality trend refers to long-term patterns showing gradual changes over weeks or years, helping you see improvements or worsening conditions. An air quality event is a sudden spike in pollution caused by specific incidents or conditions, demanding immediate attention but not indicating ongoing issues. Understanding the difference helps you interpret data accurately and respond appropriately. If you keep exploring, you’ll discover how to distinguish these effectively for better air quality management.

Get home appliances delivered free with Prime
- Fast, free delivery on millions of items
- Prime Video, Amazon Music and more included
- Member-only deals all year
Key Takeaways
- Trends show long-term patterns in pollution levels, while events are short-term spikes caused by specific incidents.
- Trends help evaluate the effectiveness of pollution control measures over time.
- Events often trigger immediate health advisories but do not indicate ongoing pollution issues.
- Monitoring techniques differentiate between gradual changes and sudden pollution surges.
- Recognizing the difference guides appropriate responses, whether long-term policies or immediate actions.
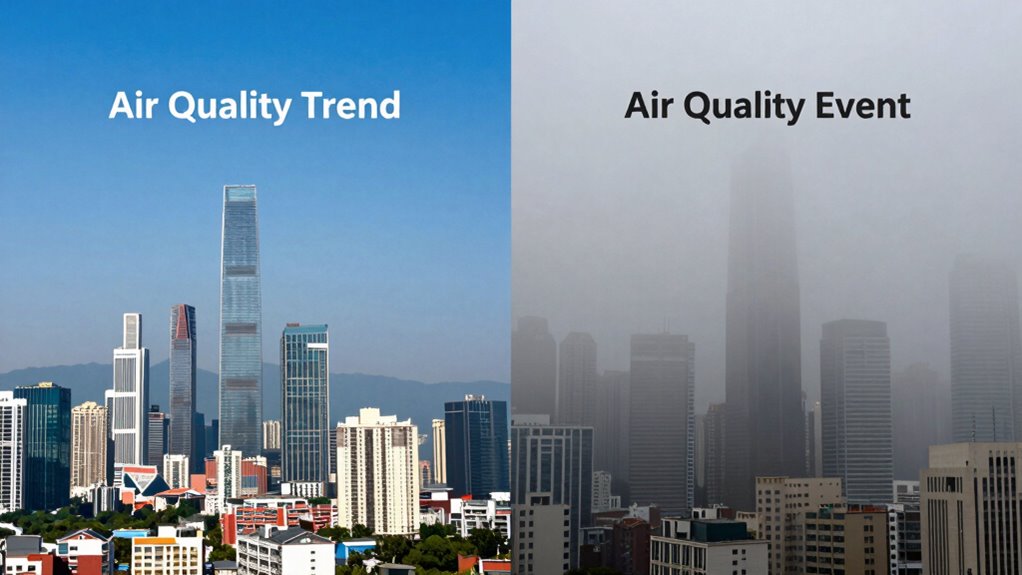
Understanding the difference between an air quality trend and an air quality event is essential for interpreting pollution data accurately. When you look at air quality reports, it’s crucial to distinguish whether the data reflects a long-term pattern or a short-term incident. An air quality trend refers to the gradual changes in pollution levels over weeks, months, or even years. It shows whether pollution is improving, worsening, or stabilizing over time. Recognizing these trends helps you understand the effectiveness of pollution control measures, such as regulations targeting pollution sources, or the impact of seasonal changes. Conversely, an air quality event is a sudden, short-term spike in pollution—like a smog episode caused by stagnant air, wildfires, or industrial accidents. These events often lead to health advisories and require immediate attention but don’t necessarily indicate a long-term problem unless they become recurrent.
To accurately interpret these phenomena, understanding the pollution sources involved is essential. Different sources—such as vehicle emissions, industrial processes, or natural events—contribute variably to pollution levels. Monitoring techniques play a key role in capturing this data. Continuous monitoring stations collect real-time information, tracking fluctuations minute-by-minute, which helps identify whether a spike is a one-off event or part of a larger trend. Satellite imagery and remote sensing also contribute by providing broader spatial data, revealing patterns over larger areas. Employing Monitoring techniques that utilize various data sources enhances the accuracy of trend and event detection. Additionally, understanding pollution sources allows for more targeted responses and better data interpretation. Employing advanced analysis methods can improve the distinction between transient events and persistent trends. Recognizing the importance of data integration from multiple sources ensures a more comprehensive understanding of air quality situations.
Recognizing an air quality trend involves analyzing data over extended periods, looking for consistent patterns or changes that suggest a shift in pollution levels. It requires patience and a thorough approach, often involving statistical analysis to filter out temporary fluctuations. On the other hand, identifying an air quality event relies on recognizing sudden deviations from normal levels, often accompanied by weather conditions or specific pollution sources. While events can be alarming, they don’t necessarily reflect ongoing issues unless similar episodes recur frequently. Furthermore, the use of multiple monitoring techniques ensures a comprehensive understanding of both trends and events, helping to formulate appropriate responses.
Products Worth Considering

Blueair Blue Pure 511i Max Smart Air Purifier

Levoit Core 400S-P Smart Air Purifier for Large Rooms

LEVOIT Vital 200S-P Smart Air Purifier for Large Rooms
As an affiliate, we earn on qualifying purchases.
Frequently Asked Questions
How Are Air Quality Trends Measured Over Time?
You measure air quality trends over time through air quality sampling, collecting data regularly from sensors or stations. Then, you analyze this data to identify patterns or changes. Data analysis helps you track variations in pollutant levels, enabling you to see whether air quality improves or worsens over specific periods. This ongoing process provides a clear picture of long-term air quality, informing policies and health advisories.
What Causes Sudden Air Quality Events?
Imagine thick smoke suddenly billowing into the sky—that’s a sudden air quality event. These occur because of air pollution spikes from sources like industrial accidents, vehicle emissions, or wildfires. Weather fluctuations, such as sudden wind shifts or temperature drops, also play a big role, trapping pollutants close to the ground and causing abrupt deterioration in air quality. You experience these as sudden, noticeable changes in the air you breathe.
Can Trends Predict Future Air Quality Issues?
Yes, you can use air quality forecasts and pollution modeling to predict future air quality issues. These tools analyze current data and identify patterns, helping you anticipate potential pollution spikes. By monitoring trends and running simulations, you get a clearer picture of upcoming conditions. This proactive approach allows you to take steps to reduce exposure and implement measures to improve air quality before problems escalate.
How Do Local Policies Impact Air Quality Events?
Imagine clear skies suddenly clouded by smoke—your local policies and regulatory influence directly shape this scene. When policies tighten standards, they cut emissions like a gardener pruning overgrown branches, reducing air quality events. Conversely, lax regulations can allow pollutants to build up, creating storms in the air. Your community’s policies act as the weather forecast, determining whether the air remains calm or turns turbulent with pollution spikes.
What Technology Is Used to Monitor Air Quality?
You use air sensors to monitor air quality in real-time, collecting data on pollutants like particulate matter and gases. These sensors send information to data analytics platforms, which analyze the data to identify patterns or sudden changes. This technology helps you track air quality trends and detect events, enabling timely responses and informed decisions to improve environmental health. Continuous monitoring guarantees you stay aware of air quality conditions around you.
Conclusion
Understanding the difference between an air quality trend and an event helps you better interpret pollution data. Trends show long-term changes, while events highlight short-term spikes. Did you know that in 2022, over 80% of cities experienced at least one air quality event? Recognizing these patterns allows you to take timely action, protect your health, and advocate for cleaner air. Stay informed, and you’ll be better equipped to navigate air quality fluctuations in your daily life.