To set up a DIY air quality monitor with open-source sensors, start by selecting reliable sensors like PMS5003 for particulate matter or MQ series for gases, and connect them to a microcontroller such as Raspberry Pi or Arduino. make certain proper wiring, calibration, and stable power supply to get accurate readings. Use visualization tools like Grafana or Python libraries to analyze data over time. If you want to learn more about optimizing your system, continue exploring the detailed steps ahead.
Key Takeaways
- Select appropriate open-source sensors (e.g., MQ series, PMS5003) based on targeted air quality parameters.
- Properly connect sensors to a microcontroller like Raspberry Pi or Arduino, ensuring stable wiring and power supply.
- Calibrate sensors regularly using known standards to ensure accurate, reliable air quality readings over time.
- Collect continuous data and visualize it with tools like Grafana or Python libraries for trend analysis and source identification.
- Perform routine maintenance and troubleshooting to maintain sensor accuracy and data reliability in long-term monitoring.
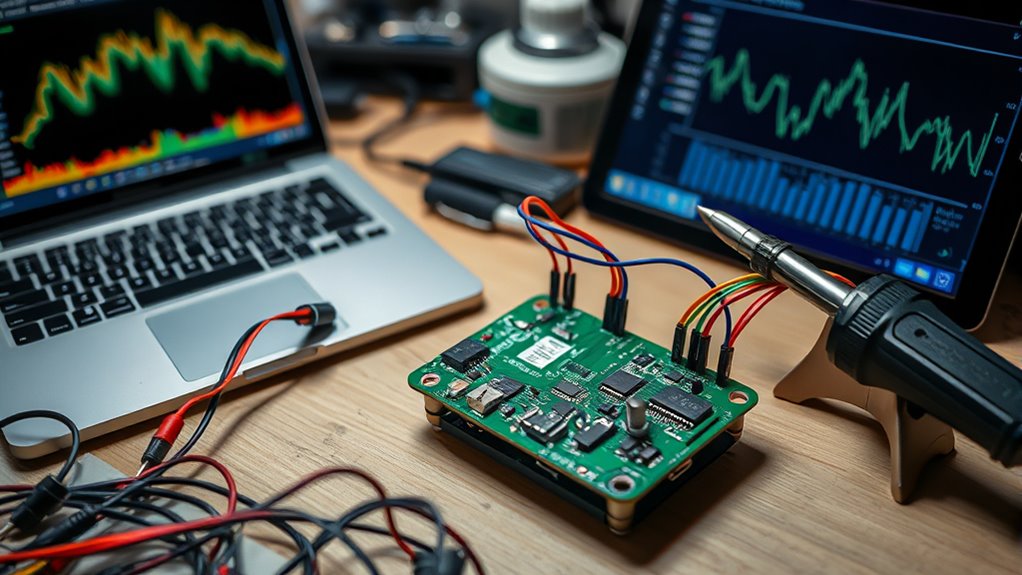
Ever wonder how you can keep track of the air you breathe without spending a fortune? Building a DIY air quality monitor with open-source sensors is a practical way to do just that. The first step involves choosing the right sensors, like the MQ series for gases or the PMS5003 for particulate matter. Once you have your sensors, you need to set up your hardware—connecting them to a microcontroller such as a Raspberry Pi or Arduino. But before you start collecting data, you must focus on sensor calibration. Accurate readings depend on proper calibration to account for environmental factors and sensor drift over time. Calibration involves comparing your sensor’s output to known concentrations or standards, then adjusting the readings in your software to make sure they reflect real-world conditions. This step is vital because uncalibrated sensors can produce misleading data, making your monitoring efforts unreliable.
Once calibrated, you can start collecting data. The next key component is data visualization. By setting up a simple software interface, you can see real-time air quality levels displayed in graphs or charts, making it easier to interpret trends and identify pollution sources. Data visualization tools like Grafana or even basic dashboards built with Python libraries such as Matplotlib allow you to see the air quality over time, spot fluctuations, and understand how different factors impact your environment. With clear visuals, you can quickly determine if certain activities or times of day correlate with increased pollution, empowering you to take action or make adjustments in your space. Additionally, understanding the importance of high-quality sensors ensures that your data remains accurate and reliable over time.
Integrating data visualization into your monitor also helps you troubleshoot sensor issues and verify calibration accuracy. If the displayed data suddenly spikes or drops unexpectedly, it might indicate the need for recalibration or maintenance. Regularly updating your calibration process guarantees your monitor remains accurate and reliable over months or even years. Additionally, combining data from multiple sensors or locations can give you a more complete picture of your indoor or outdoor air quality, which is especially useful if you’re monitoring multiple rooms or outdoor environments.
In the end, setting up a DIY air quality monitor boils down to careful sensor calibration and effective data visualization. When you master these aspects, you’ll have a powerful, low-cost tool that keeps you informed about your environment. It’s a rewarding project that not only saves money but also enhances your understanding of the air you breathe. With consistent calibration and insightful data visualization, you’ll be able to make smarter decisions, improve your indoor air quality, and contribute to a healthier living space—all without breaking the bank.
Frequently Asked Questions
What Are the Best Open-Source Sensors for Detecting VOCS?
When choosing open-source sensors for detecting VOCs, you want options with good sensor accuracy and reliable data calibration. Sensors like the Figaro TGS2600 or the MiCS-5524 are popular because they provide decent VOC detection at an affordable price. Keep in mind that you’ll need to regularly calibrate your sensor to maintain accuracy. Proper calibration and understanding sensor limitations will make certain your measurements are precise and useful.
How Often Should I Calibrate My DIY Air Quality Monitor?
Sensor sensitivity and accuracy vary, so you should calibrate your DIY air quality monitor regularly. Follow a consistent maintenance schedule—ideally, monthly or quarterly—to guarantee reliable readings. Calibration helps correct drift and inaccuracies, keeping your sensor’s signals sharp and precise. By maintaining a mindful maintenance schedule, you ensure your monitor remains accurate, so you can confidently monitor air quality and make informed decisions about your environment.
Can I Connect Multiple Sensors for Comprehensive Air Monitoring?
Yes, you can connect multiple sensors for extensive air monitoring. Proper sensor placement is key—you’ll want to position sensors in different locations to capture varied air quality data. Make sure your data logging setup can handle multiple inputs, allowing you to record and analyze data from each sensor. This approach gives you a clearer picture of air quality variations across different areas, improving your monitoring accuracy.
What Are the Power Options for a Portable DIY Air Quality Monitor?
You want portable power options for your DIY air quality monitor. Battery options like rechargeable lithium-ion or AA batteries provide flexibility, letting you use it anywhere. Solar power is also a great choice, especially for outdoor use, as it can keep your device charged sustainably. Combining batteries with solar panels can extend your monitor’s runtime, ensuring continuous air quality monitoring without the need for constant recharging.
How Do I Interpret the Sensor Data Accurately?
To interpret your sensor data accurately, start with proper sensor calibration to make certain readings are precise. Regularly compare your data against known standards or reference instruments. Use data visualization tools like graphs or charts to identify patterns and anomalies easily. This helps you understand fluctuations in air quality over time. Consistent calibration and clear visualization enable you to make informed decisions about air quality and potential health risks.
Conclusion
By building your own air quality monitor, you gain awareness, enhance safety, and take control of your environment. You’ll see the air you breathe, understand the pollutants present, and make informed decisions. You’ll customize your setup, monitor continuously, and share your findings. Creating your DIY air quality monitor isn’t just about technology; it’s about empowerment, education, and making a difference. Take action today, and breathe easier tomorrow.