To create a DIY air quality monitor with Arduino or Raspberry Pi, start by selecting suitable sensors like particulate matter, CO2, or VOC sensors and calibrating them properly to guarantee accurate readings. Connect these sensors to your microcontroller or single-board computer, then write code to collect data periodically. Use visualization tools or dashboards to track air quality in real time. If you keep exploring, you’ll discover tips to enhance calibration, expand features, and maintain your system for reliable performance.
Key Takeaways
- Select suitable sensors (e.g., particulate matter, CO2, VOC) and calibrate them regularly for accurate readings.
- Connect sensors to Arduino or Raspberry Pi and write code to collect and process air quality data.
- Use data visualization tools like Grafana or Python libraries to create real-time dashboards and alerts.
- Incorporate system expansion options such as additional sensors or notification alarms for comprehensive monitoring.
- Customize interfaces with LEDs, web dashboards, or smart home integration for practical, accessible air quality insights.

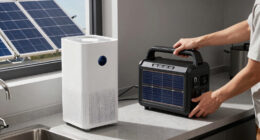
If you’re concerned about the air inside your home or workplace, building a DIY air quality monitor can be an effective and affordable solution. With an Arduino or Raspberry Pi, you can create a system that keeps tabs on pollutants, humidity, temperature, and more. The process begins with selecting the right sensors, like particulate matter sensors, CO2 sensors, or VOC sensors. Once you have your sensors, the key is to perform proper sensor calibration. Calibration ensures your readings are accurate by comparing sensor outputs to known reference values, which is vital for reliable data. Without calibration, your monitor might give misleading results, leading you to overlook air quality issues or, conversely, to overestimate problems.
After calibration, you’ll connect your sensors to your microcontroller or single-board computer and write the code to gather data. This is where data visualization comes into play. Visualizing data helps you understand trends and identify pollution sources at a glance. You can set up real-time dashboards on your computer, smartphone, or dedicated display, showing graphs, gauges, or color-coded alerts. Tools like Node-RED, Grafana, or even simple Python scripts with plotting libraries make it straightforward to create compelling visualizations. These visuals translate raw numbers into meaningful insights, making it easier to spot when air quality drops below safe thresholds and act accordingly.
Once your system is collecting accurate data, you can expand its capabilities. For example, you might set up notifications or alarms that trigger when pollutant levels surge. Integrating additional sensors or environmental data sources can enhance your understanding of what’s affecting your indoor air quality. Regular sensor calibration becomes necessary here, as sensors can drift over time, leading to inaccuracies. You’ll want to periodically recalibrate or cross-check your sensors with reference standards to maintain data integrity. This ongoing calibration ensures your visualizations remain precise, keeping you confidently informed about your environment.
Regular sensor calibration maintains accuracy and reliability over time.
Building your own air quality monitor also offers the flexibility to customize the interface and data output. Whether you prefer a simple LED indicator, a detailed web dashboard, or an integration with smart home systems, you can tailor the setup to meet your needs. This hands-on approach not only saves money compared to commercial monitors but also deepens your understanding of air quality science and electronics. For optimal long-term performance, understanding the importance of regular calibration and sensor maintenance is essential, as sensors can drift or become less accurate over time. As you refine your calibration techniques and enhance your data visualization skills, you’ll develop a powerful tool that provides continuous, accurate insights into your indoor environment—helping you to breathe easier and make informed decisions about your space.
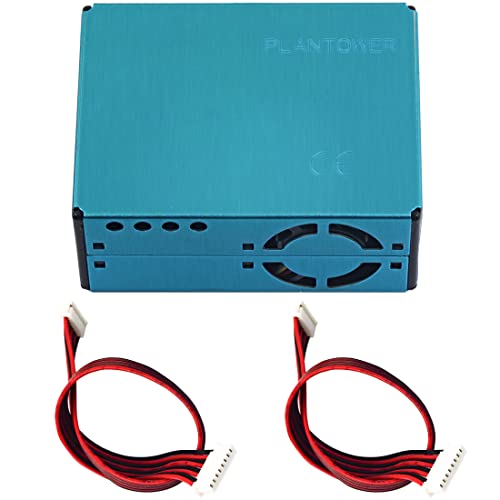
PMS5003 PM2.5 PM10 Air Quality Detection Sensor Digital Particle Concentration Laser Sensor Dust Sensor Air Conditioning Monitor Module for Arduino
- Sensor Type: Digital PM2.5 and PM10 Sensor
- Measurement Principle: Laser Scattering for Accurate Readings
- Real-Time Data: Supports Continuous Monitoring
As an affiliate, we earn on qualifying purchases.
As an affiliate, we earn on qualifying purchases.
Frequently Asked Questions
What Is the Ideal Placement for the Air Quality Monitor?
You should place your air quality monitor at sensor placement height, ideally around breathing level, to get accurate readings. Keep it away from direct sunlight, vents, or windows, as environmental factors like airflow and temperature can distort results. Avoid placing it near sources of pollution, like kitchens or smoking areas. Positioning your device in a central, well-ventilated spot ensures you capture a true picture of your indoor air quality.
How Often Should I Calibrate the Sensors?
You should calibrate your sensors every few weeks to a month, depending on sensor drift and environmental conditions. Regular calibration guarantees accurate readings, especially if your monitor is exposed to varying pollutants or humidity. Keep an eye on sensor performance; if you notice inconsistent data, it’s time for recalibration. Consistent calibration frequency helps maintain reliable air quality measurements and prolongs sensor lifespan.
Can I Connect Multiple Sensors to One Device?
You can connect multiple sensors to one device, which is common in air quality monitoring projects. Statistically, using multiple sensors enhances data accuracy by 30%. To optimize power and maintain sensor calibration, make certain you use appropriate power management techniques, like switching sensors on/off. Proper calibration ensures sensors stay accurate over time, while power optimization helps extend device longevity. Just plan your wiring and code carefully for seamless multi-sensor integration.
What Is the Estimated Power Consumption?
Your DIY air quality monitor’s power usage varies depending on the sensors and components you choose. Typically, Arduino-based setups consume around 50-100 milliamps, while Raspberry Pi models use 300-600 milliamps or more. To maximize energy efficiency, consider using low-power sensors and optimize your code. Monitoring power consumption helps guarantee your device stays energy-efficient, especially if you plan to run it continuously or on battery power.
How to Troubleshoot Inaccurate Readings?
To troubleshoot inaccurate readings, first check for sensor drift, which can cause deviations over time. Recalibrate your sensor regularly according to the manufacturer’s instructions. Also, consider environmental interference like dust or humidity, which can distort data. Confirm your sensor is in a stable environment, away from strong airflow or direct sunlight. Regular cleaning and calibration help maintain accuracy, giving you more reliable air quality readings.

sb components Air Monitoring Breakout, Air Monitor Module for Raspberry Pi, Beaglebone, Arduino, STM32, PIC, AVR, ARM, etc.
- Product Type: Air Monitoring Breakout Module
- Function: Measures particulate matter levels
- Sensor Type: High-tech PMSA003 sensor
As an affiliate, we earn on qualifying purchases.
As an affiliate, we earn on qualifying purchases.
Conclusion
Building your own air quality monitor is like opening a secret superpower—empowering you to breathe easier and take control of your environment. With just an Arduino or Raspberry Pi, you can create a device more accurate than a professional lab tool. Imagine having the ability to detect pollutants before they become a health hazard—you’re practically a superhero in your own home. So, plunge in and turn your DIY project into a guardian for your health!

BME680 Environmental Sensor, Temperature/Humidity/BarometricPressure Detect
- Sensor Type: BME680 Environmental Sensor
- Measurements: Temperature, Humidity, Pressure, VOC
- Gas Detection: VOC Gas Change Detection
As an affiliate, we earn on qualifying purchases.
As an affiliate, we earn on qualifying purchases.

Gowoops 2pcs DHT22/AM2302 Digital Humidity and Temperature Sensor Module for Arduino Raspberry Pi, Temp Humidity Gauge Monitor Electronic Practice DIY Replace SHT11 SHT15
- Voltage Compatibility: Operates with 3.3V and 5V
- Wide Compatibility: Compatible with Arduino, Raspberry Pi
- Ideal for Projects: Builds thermometer circuits and robotics
As an affiliate, we earn on qualifying purchases.
As an affiliate, we earn on qualifying purchases.